
About the bootcamp
Practice-first bootcamps in data analytics, software development and digital employability
Hammad Technologies runs intensive, supervised bootcamps that take participants from fundamentals to portfolio-grade professional work — then certifies and verifies them under the bootcamp they completed.
What it is
Training, internship and certification in one programme
Participants do not simply watch lessons. Every week combines instruction with graded practical work, reviewed by professional supervisors who correct method as well as output.
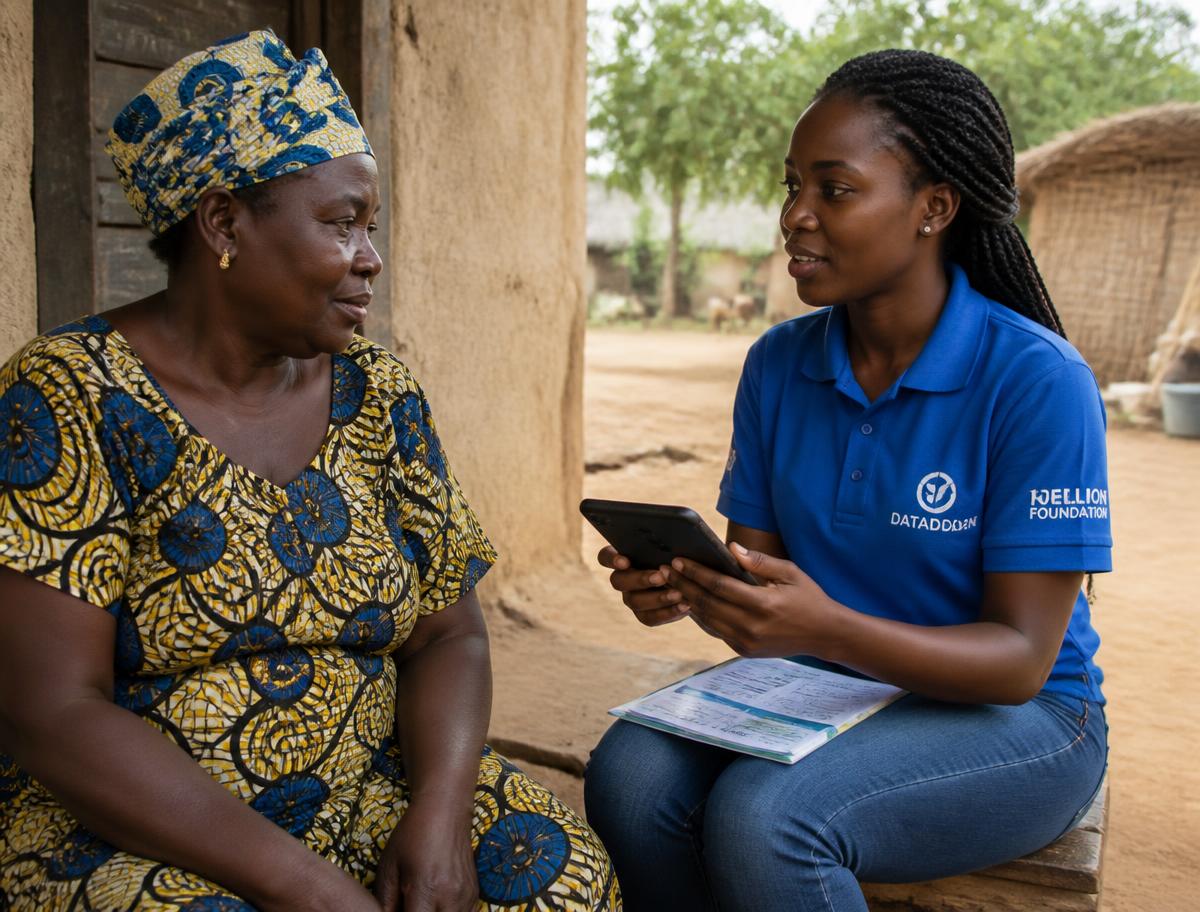
The bootcamp culminates in an individual field survey and a capstone project that becomes the centrepiece of each graduate's portfolio. Graduates leave with demonstrable evidence of work — dashboards, statistical reports, cleaned datasets and documented methodology — plus a verifiable certificate.
Who should join
- Graduates and undergraduates seeking practical, employable data skills.
- Monitoring and evaluation, research and health information officers.
- Public sector staff who prepare reports and manage records.
- Business owners and NGO staff who work with survey or operational data.
- Career switchers with basic computer literacy and a laptop.
Structure
The 90-day journey
- 01
Weeks 1–3
Data foundations
Analytics mindset, data types, Excel mastery, cleaning workflows, formulas and structured reporting.
- 02
Weeks 4–6
Collection & databases
Survey design with ODK, KoboCollect and CommCare, plus SQL querying and relational data management.
- 03
Weeks 7–9
Visualization & statistics
Power BI modelling and DAX, dashboard design, SPSS statistical testing and interpretation.
- 04
Weeks 10–12
Field survey & capstone
Individual field survey, weekly mini projects, supervised capstone project and final presentation.
Learning outcomes
What you will be able to do by graduation
Design survey instruments and collect clean field data on mobile devices.
Clean, transform and document messy datasets reproducibly.
Write SQL to query, join and summarise relational data.
Build interactive Power BI dashboards with modelled data and DAX measures.
Run and interpret statistical tests in SPSS with correct assumptions.
Present findings clearly to non-technical decision makers.
Tools
Tools covered in the curriculum
Questions